April in the Vail Valley is that in-between season, when winter loosens its grip and summer quietly starts to take shape. It’s also when the market reveals its nuances. Right now, activity is highly micro-driven, and the real story lies in understanding which properties are going under contract, and more importantly, why. That’s where the insight is. It’s a moment to look beyond headlines and dig into the data, the inventory, and the subtle shifts happening within our most sought-after neighborhoods.
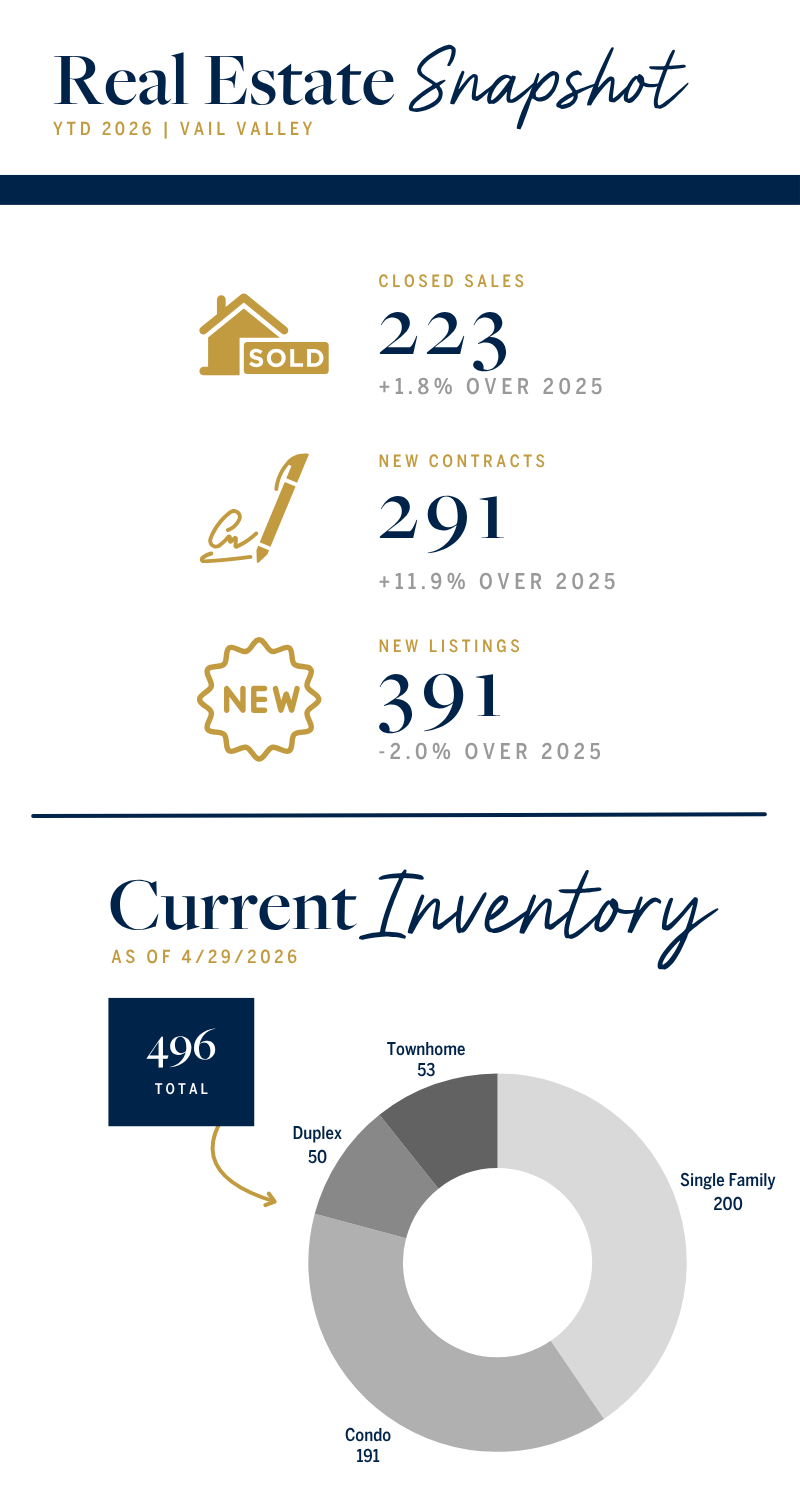
While there’s a perception of more listings coming online this spring, overall inventory has remained relatively steady month-over-month, holding around the 500± mark for residential properties across Eagle County. That could change in the next couple of months, so as always, I will be keeping a close eye on what is happening.
This month, we’re taking a closer look at three of the Vail Valley’s premier golf course communities: Arrowhead, Singletree and Cordillera – analyzing five-year trends in median sales price, price per square foot, and days on market.
Spring in the mountains is fleeting; let’s make the most of it!
In This Newsletter:
- Spring Has Sprung & So Has The Market – This month we’re diving into three of the valley’s premier golf community neighborhoods (Arrowhead, Singletree, and Cordillera) comparing their median sales prices and price per square foot trends against the broader Eagle County market. Spoiler alert: if you own property in any of these communities, you’ve had a very good few years.
- Featured Listings Not To Miss – Don’t forget to check out my listings below in this email! Ask me about potential upcoming properties that may not be on the market.
As always, thank you for reading and being part of this community. If you’re thinking about buying, selling, or simply want to chat about the market or local lifestyle, I’d love to connect – just reply or reach out directly.

This month, we’re diving into key trends across Arrowhead, Singletree and Cordillera; three distinct neighborhoods that consistently attract buyers for their lifestyle, views, and proximity to amenities. Let’s explore how pricing, demand, and timing are shaping the market within each area.
Metric #1: Median Sales Price
Each community shows a unique pattern, but a few consistent themes emerge: seasonality, limited inventory, and the outsized impact of high-end sales.
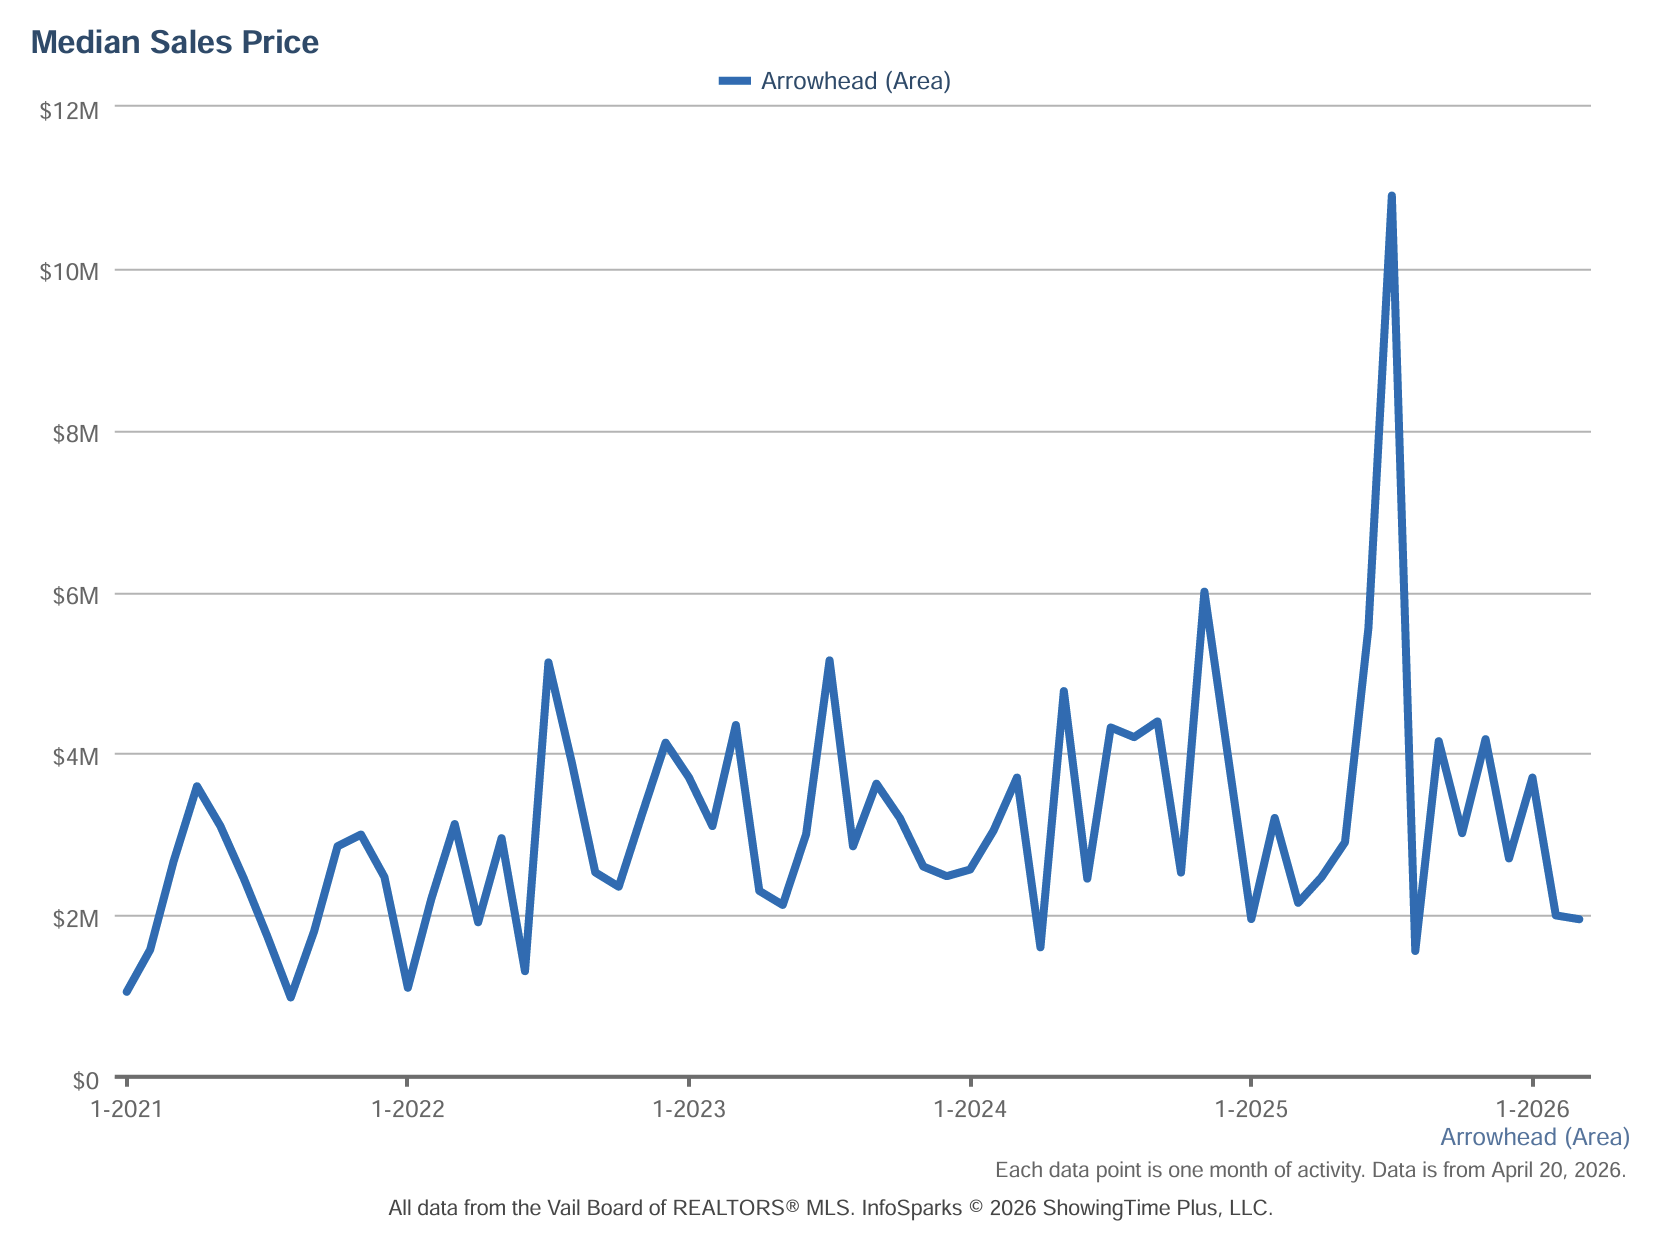
ARROWHEAD – MEDIAN SALES PRICE (LAST 5 YEARS)
Arrowhead started 2021 with a median sales price bouncing in the $1M–$3.5M range, which in hindsight looks like a bargain. The trajectory from 2022 onward has been a clear staircase upward, with the median regularly reaching $4M–$5M+ and a truly remarkable spike to approximately $11M in mid-2025 — the highest recorded median in the five-year window for this community. That peak reflects a period when several significant properties transacted simultaneously, pulling the median well above its typical range. The subsequent pullback to the $2M–$4M range in early 2026 is not a red flag; it’s a return to the neighborhood’s normal cadence after an extraordinary run of high-end closings. The floor of Arrowhead’s median has risen meaningfully — months that once registered $1M medians now rarely dip below $2M, which is the more important signal for long-term value.
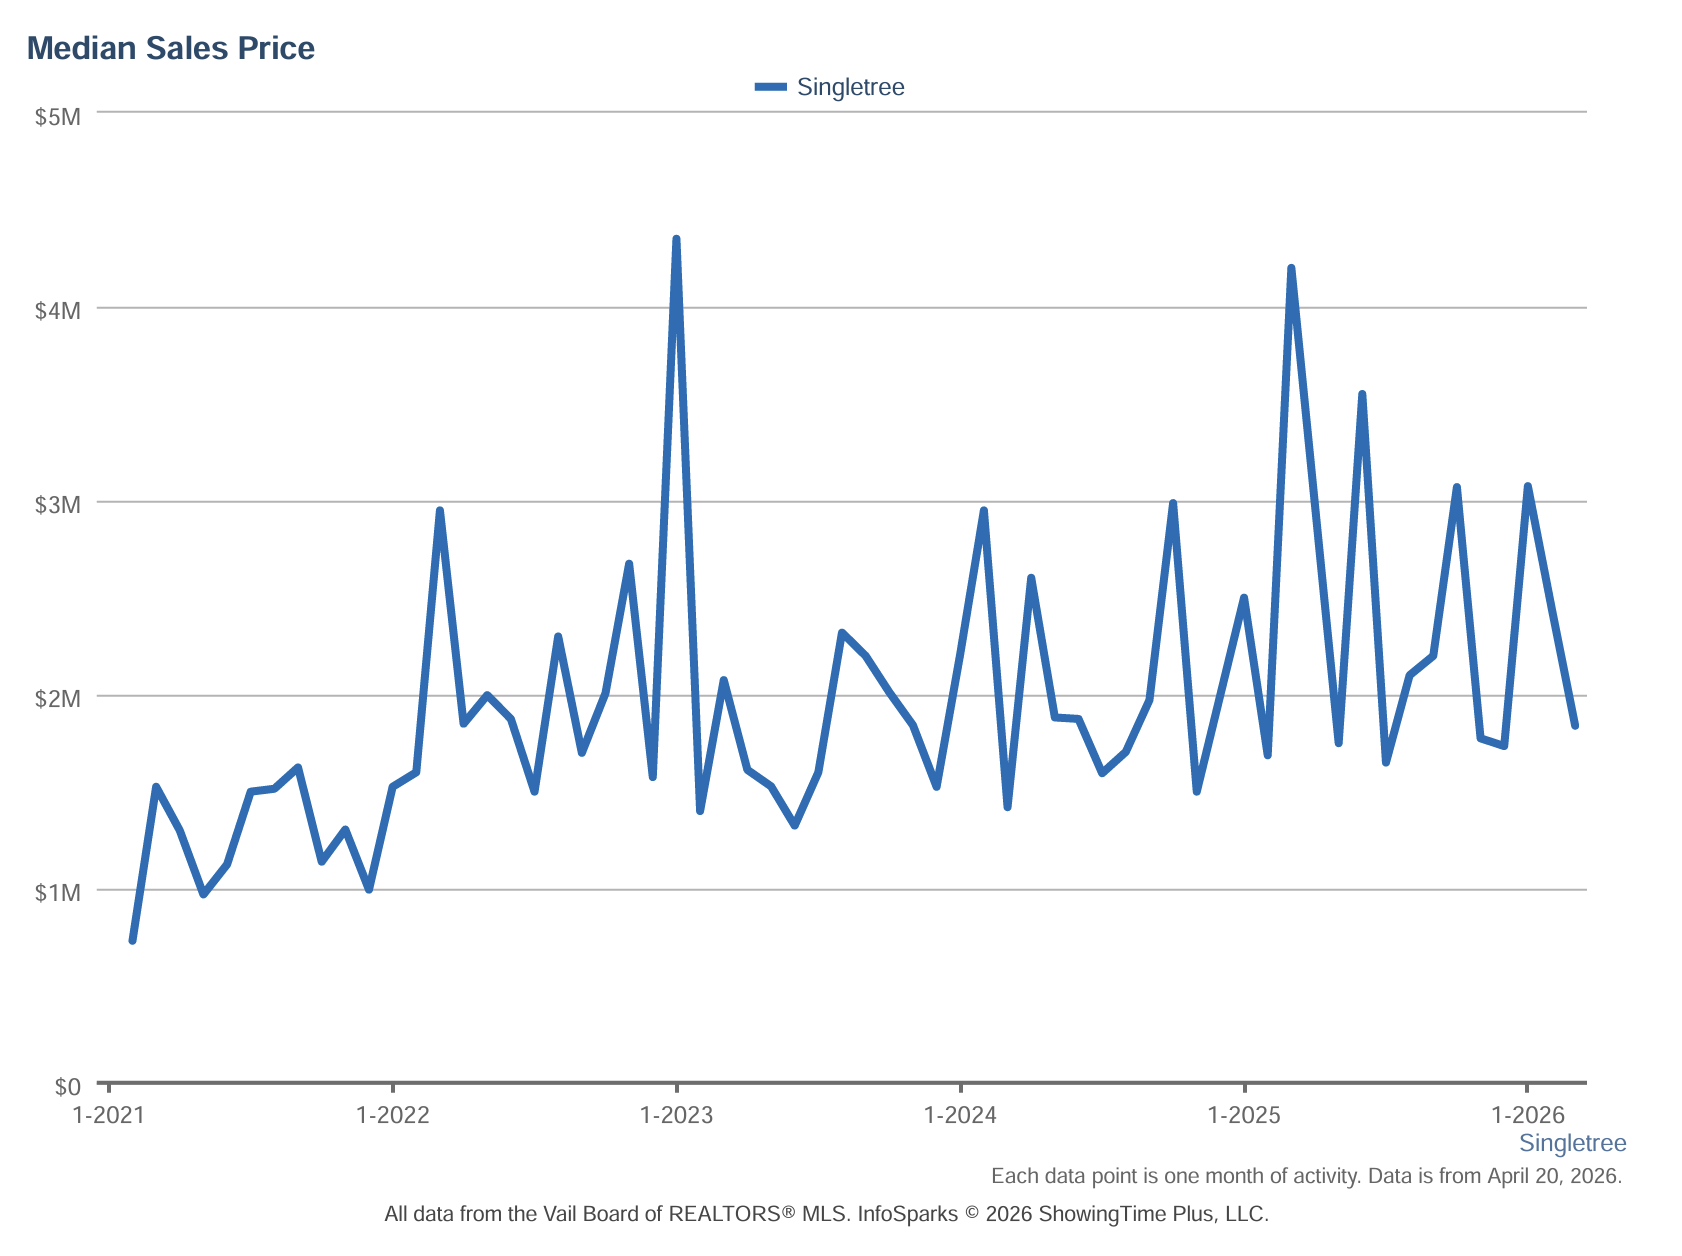
SINGLETREE – MEDIAN SALES PRICE (LAST 5 YEARS)
Singletree tells a story of quiet, steady appreciation punctuated by occasional high-end outliers. Starting below $1M in early 2021, the neighborhood’s median has broadly risen into a $1.5M–$3M+ trading range, with a notable spike to nearly $4.5M in early 2023 and another approach to $4.3M in mid-2025. Those peaks coincide with the sale of larger, higher-end homes that sit at the top of Singletree’s price spectrum — the community has a wide range of product types, from modest townhomes to substantial single-family homes, so the median can move significantly depending on what’s actually closing in a given month. The more consistent baseline, now settling in the $2M–$3M+ range, represents genuine appreciation from that sub-$1M starting point five years ago. For a neighborhood that was long considered the “practical” choice in the valley’s golf community lineup, these are not modest numbers.
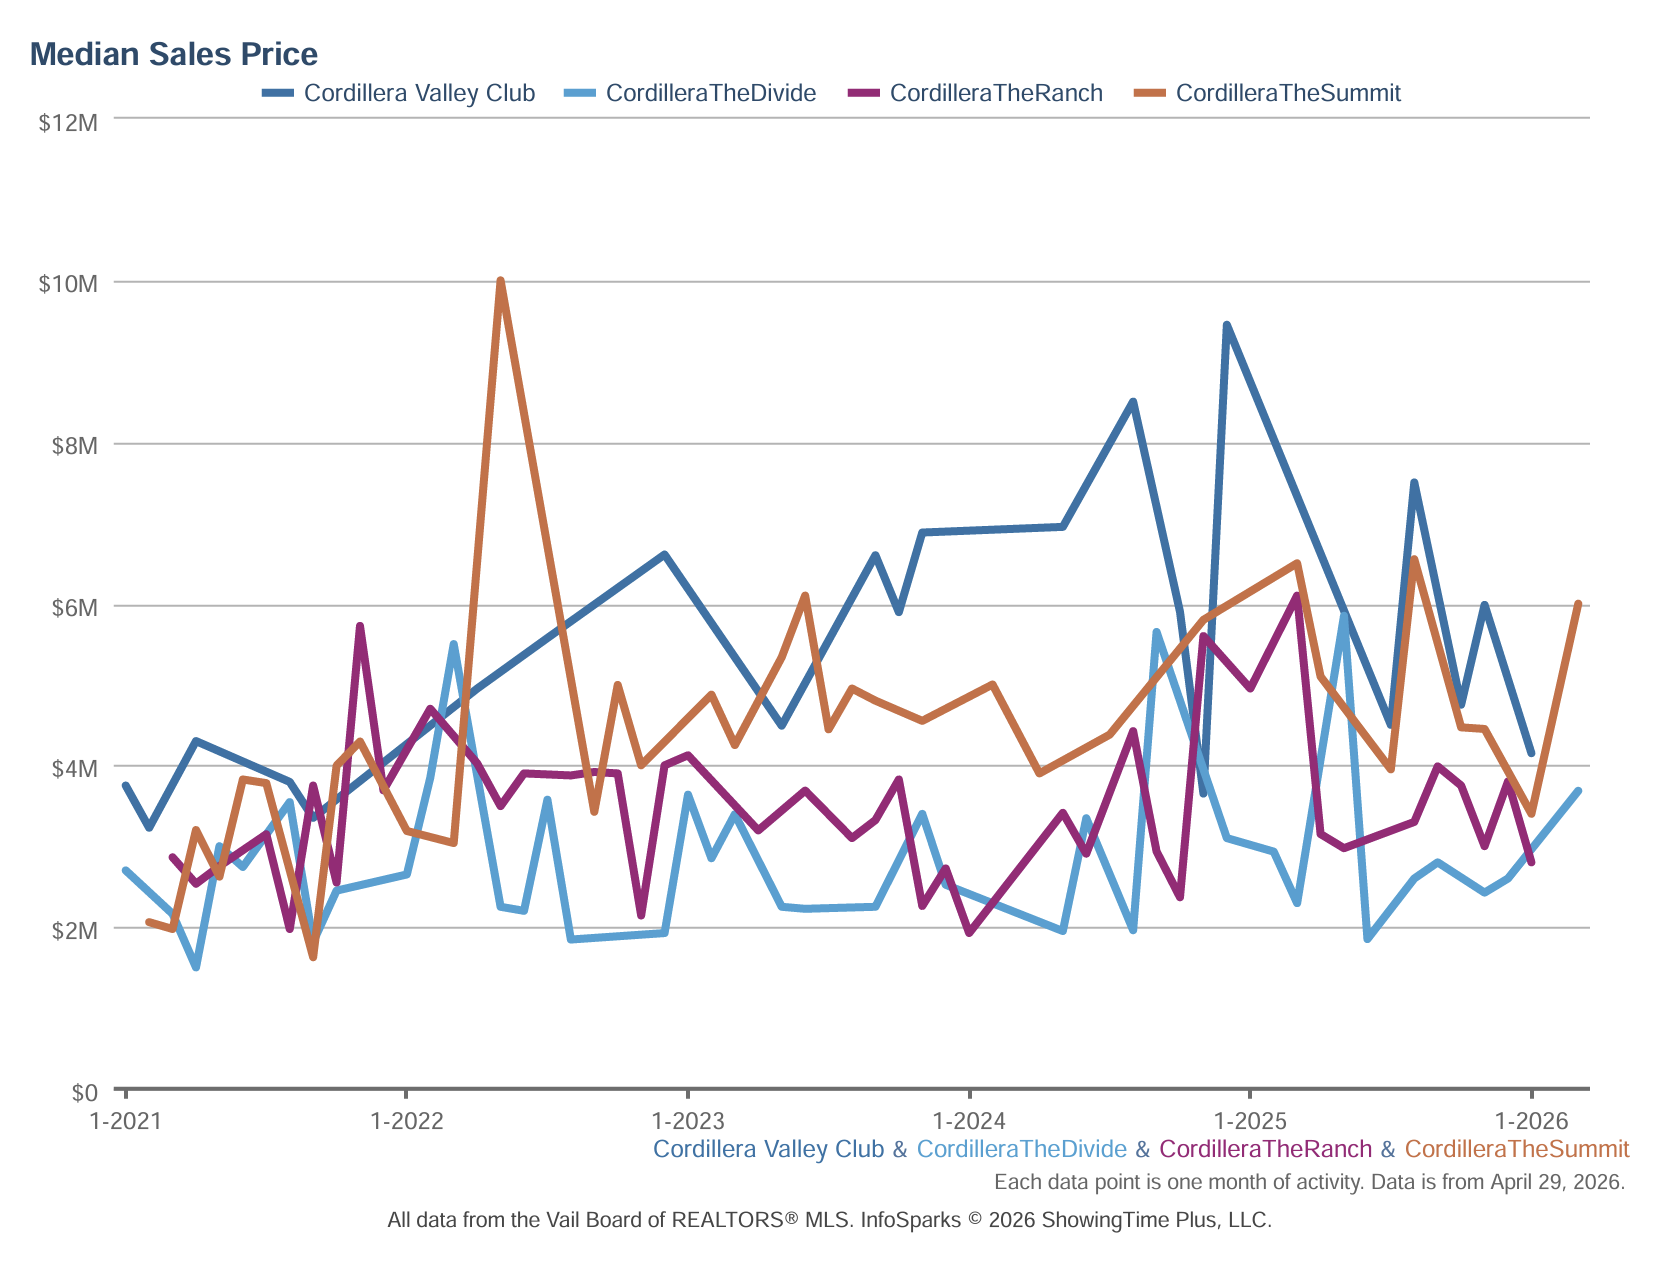
CORDILLERA – MEDIAN SALES PRICE (LAST 5 YEARS)
If there’s one word to describe Cordillera’s median sales price chart over the past five years, it’s divergence because the four sub-neighborhoods, while sharing an common name, have increasingly gone their own directions.
The Valley Club has emerged as the clear price leader within the community, and the trajectory has been striking. Starting around $3.5M–$4M in early 2021, the Valley Club’s median has climbed steadily, with peaks reaching $8.3M in mid-2024 and an impressive $9.5M in early 2025. This represents the highest sustained median of any Cordillera sub-neighborhood across the entire five-year window. The recent moderation to the $4M–$6M range in early 2026 reflects normal post-peak consolidation rather than any loss of desirability as the floor has risen substantially from where it started.
The Summit produced the single most dramatic data point in the entire Cordillera chart: a spike to approximately $10M in early 2022, the peak of the pandemic-era luxury frenzy. After that peak, median values settled back into a $4M–$6.5M range through 2023–2024, before resuming an upward climb that has brought The Summit’s median back toward $6M+ in early 2026.
The Divide has generally traded in a $2M–$6M range, with meaningful volatility reflecting a smaller transaction pool. It has arguably been the most consistent mid-range option within Cordillera, offering buyers access to the broader community amenities at a somewhat more accessible entry point. The chart shows The Divide tracking broadly in line with The Ranch through much of the period, though recent data points suggest some upward movement toward the $3.5M–$4M range heading into 2026.
The Ranch has occupied the most consistent band of the four, generally trading between $2M and $5.8M with less dramatic spikes than its neighbors. That consistency can be read two ways: as stability, or as an area that hasn’t yet had its breakout moment. Given that the Ranch was the first (and largest) neighborhood to be built out in the early 90s, there are many homes that could use a facelift which may contribute to the more stable market trend.
SUMMARY
Across all three communities, the median sales price five years ago looks (to borrow a term from the slopes) like buying a season pass before the mountain got discovered. Values have moved substantially and durably upward. The volatility in any given month is a feature of low-inventory luxury markets, not a bug.
For buyers, the lesson is that waiting for a meaningful correction in any of these neighborhoods has been a losing strategy for five consecutive years. For sellers, the data makes a compelling case that the market has fundamentally repriced these communities to a higher level, and that’s not going anywhere.
Metric #2: Price Per Square Foot
Median sales price can be misleading when you’re dealing with low transaction volumes and wide property size ranges. Price per square foot can tell a cleaner story about underlying value trends and the individual PPSF charts for each community are genuinely compelling.
ARROWHEAD – MEDIAN SALES PRICE PER SQUARE FOOT (LAST 5 YEARS)
Arrowhead started 2021 with a median PPSF in the mid-$600s and has generally trended upward, with the range now firmly established in the $1,200–$1,550/SF territory — representing an appreciation of roughly 80–90% from the 2021 baseline. The volatility in individual months reflects the small sample sizes, but the floor has risen dramatically. While Buyers entering Arrowhead today are paying more per square foot than even three years ago, the subsequent appreciation in value is also on the same trajectory.
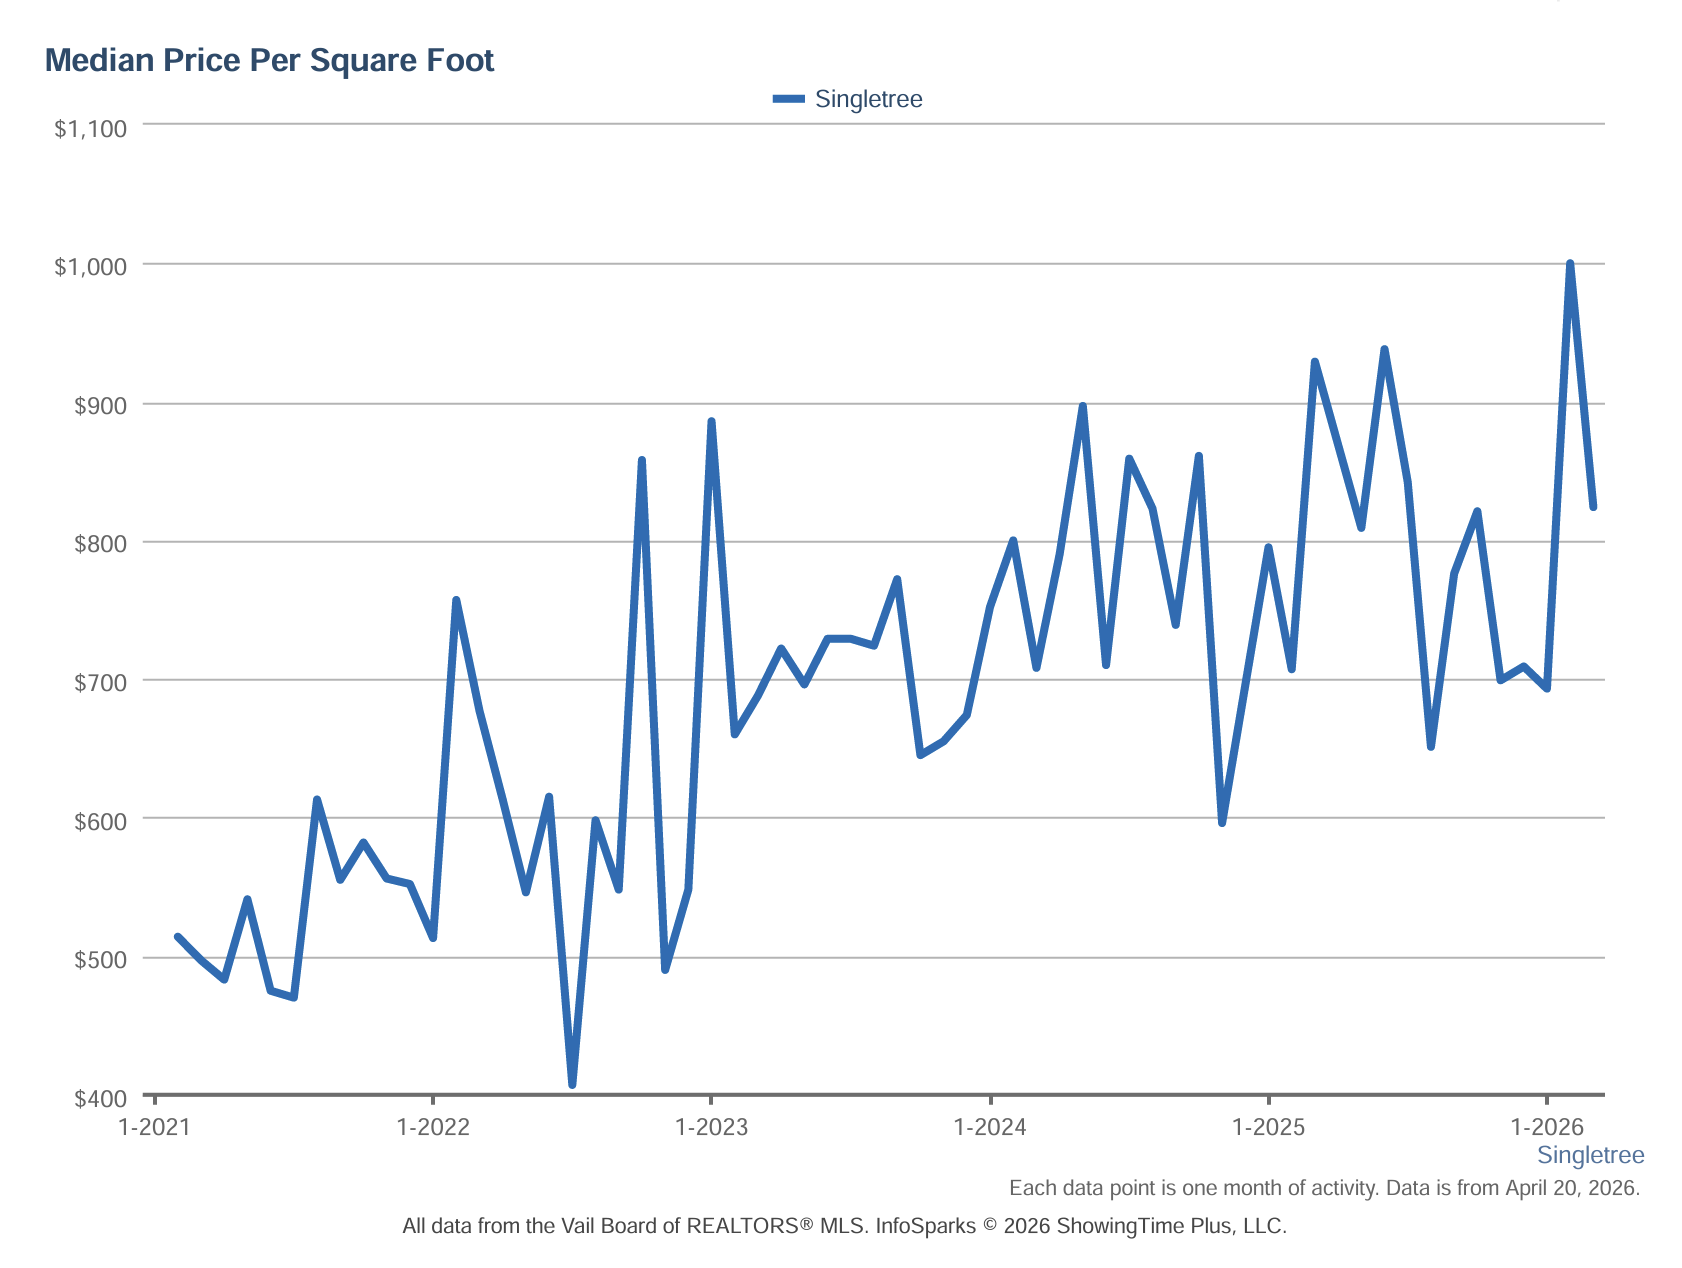
SINGLETREE – MEDIAN SALES PRICE PER SQUARE FOOT (LAST 5 YEARS)
Singletree has had perhaps the most impressive percentage run on a PPSF basis. Starting around $500/SF in early 2021, the neighborhood has climbed into the $800–$1,000+/SF range by early 2026 — a near-doubling of price per square foot. The recent spike to just over $1,000/SF is notable; if sustained, it would represent a significant psychological threshold for a community that has historically been considered the “accessible” golf lifestyle option in the valley.
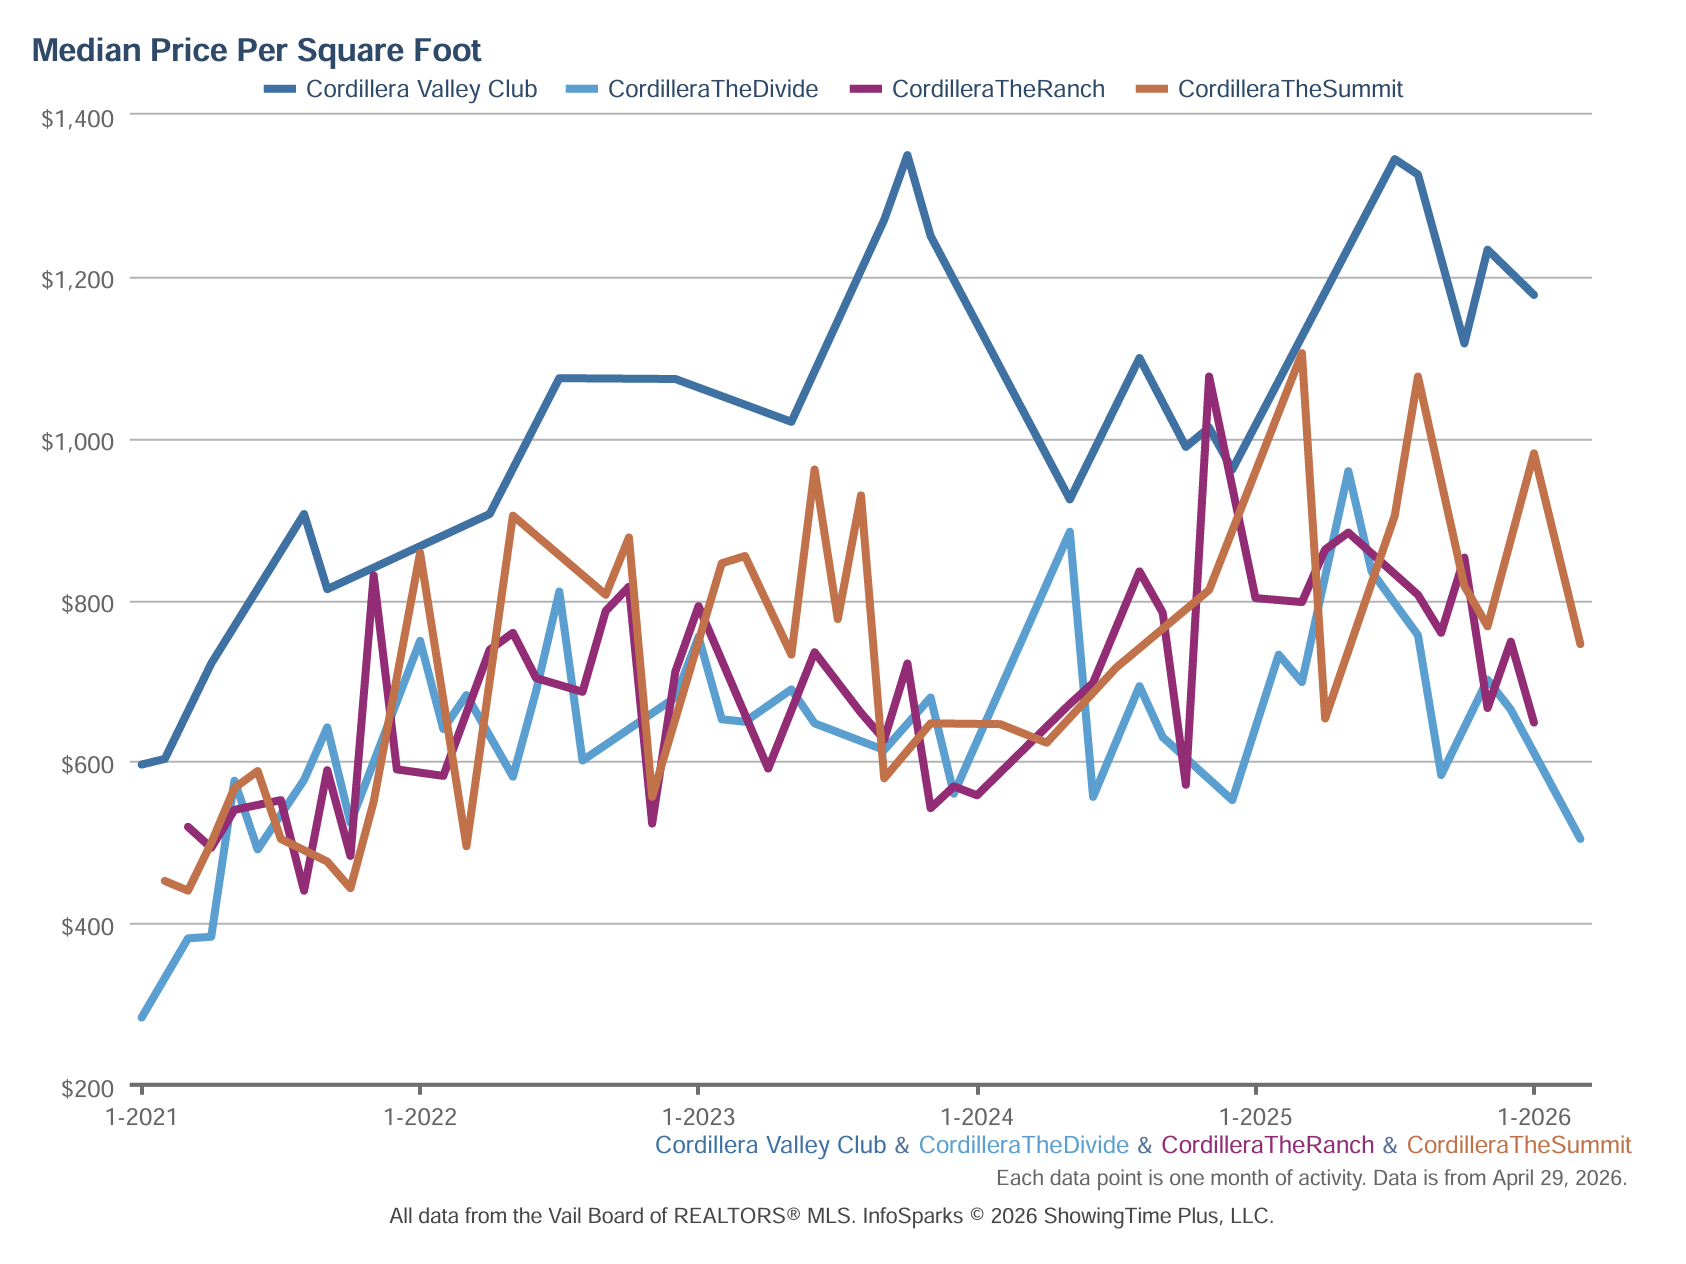
CORDILLERA – MEDIAN SALES PRICE PER SQUARE FOOT (LAST 5 YEARS)
The PPSF chart is where Cordillera’s internal hierarchy becomes unmistakable, and where the Valley Club’s premium positioning is most clearly quantified.
The Valley Club started the five-year period around $600/SF and has been on a relentless upward march, reaching peaks approaching $1,375/SF in late 2023 and again in late 2025. That’s a run of more than 100% appreciation on a per-square-foot basis in roughly four years – a number that would be extraordinary in any market, let alone a relatively low-turnover luxury community. The recent data point pulling back toward $1,200/SF likely reflects a larger or less-improved property transacting in isolation, not a trend reversal. The Valley Club’s PPSF trajectory is among the most impressive in the entire valley.
The Summit and The Ranch have followed broadly similar PPSF trajectories, starting around $450–$600/SF in 2021 and climbing into the $800–$1,100/SF range. The Summit in particular has shown notable peaks near $1,100/SF in 2025, reflecting the premium buyers will pay for the most dramatic settings even at the highest elevation. Both neighborhoods have approximately doubled their PPSF floor from where they started, which is the most meaningful measure of durable appreciation.
The Divide started below the pack touching as low as $300/SF in early 2021 and has worked its way up to a more competitive $500–$950/SF range, with recent readings around $500/SF suggesting either lower-finished properties in the mix or an opportunity gap relative to its neighbors. For buyers doing the per-square-foot math across Cordillera’s sub-neighborhoods, The Divide currently shows the widest spread from its community peers, which is either a value opportunity or a reflection of product type differences, and worth investigating on a case-by-case basis.
SUMMARY
Across all three communities, buyers are paying substantially more per square foot today than they were five years ago. For sellers, this is excellent news. For buyers, it underscores the importance of acting when the right property becomes available. Waiting for a “dip” in a supply-constrained luxury market is a strategy that has not rewarded patience in the Vail Valley.
Metric #3: Days on Market
If price per square foot tells you what the market is doing, days on market tells you how urgently it’s doing it. And the cumulative DOM charts for these three communities reveal some genuinely fascinating stories.A quick note on reading these charts: cumulative days on market reflects how long properties actually sat before going under contract, including any relisting periods. Spikes often represent a single overpriced or unusual property that lingered, rather than a broad market slowdown. In low-inventory luxury communities, one stubborn listing can dramatically move the median in a given month. Context is everything…
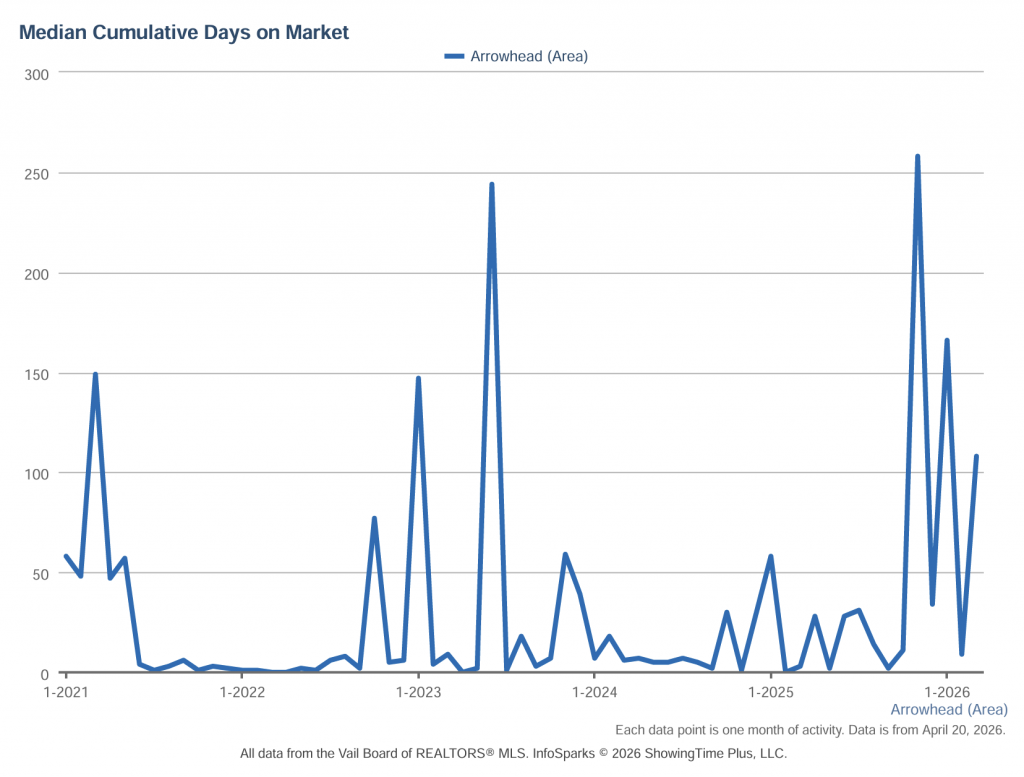
ARROWHEAD – MEDIAN CUMULATIVE DAYS ON MARKET (LAST 5 YEARS)
Arrowhead spent most of 2021 and 2022 in a frenzy — median DOM routinely touching near zero and rarely exceeding 10 days during peak periods. That’s a seller’s market operating at full throttle.
The post-pandemic demand surge had buyers writing offers on Arrowhead properties almost as fast as they hit the MLS, and sometimes faster (off-market deals were rampant during this era). The market normalized somewhat through 2023, with a notable spike approaching 250 days — almost certainly the fingerprint of one or two unique, high-ask properties that took time to find their buyers.
What’s more telling is the pattern from mid-2024 through mid-2025: DOM compressed back down significantly, often below 30 days, suggesting the demand reset was complete and buyers were re-engaged. The late 2025/early 2026 data shows another spike toward 260 days, which warrants watching – but given Arrowhead’s PPSF continuing to hold strong in the $1,200–$1,550 range simultaneously, this is more likely a sign of selective, patient buyers at the ultra-high end rather than a market losing confidence.
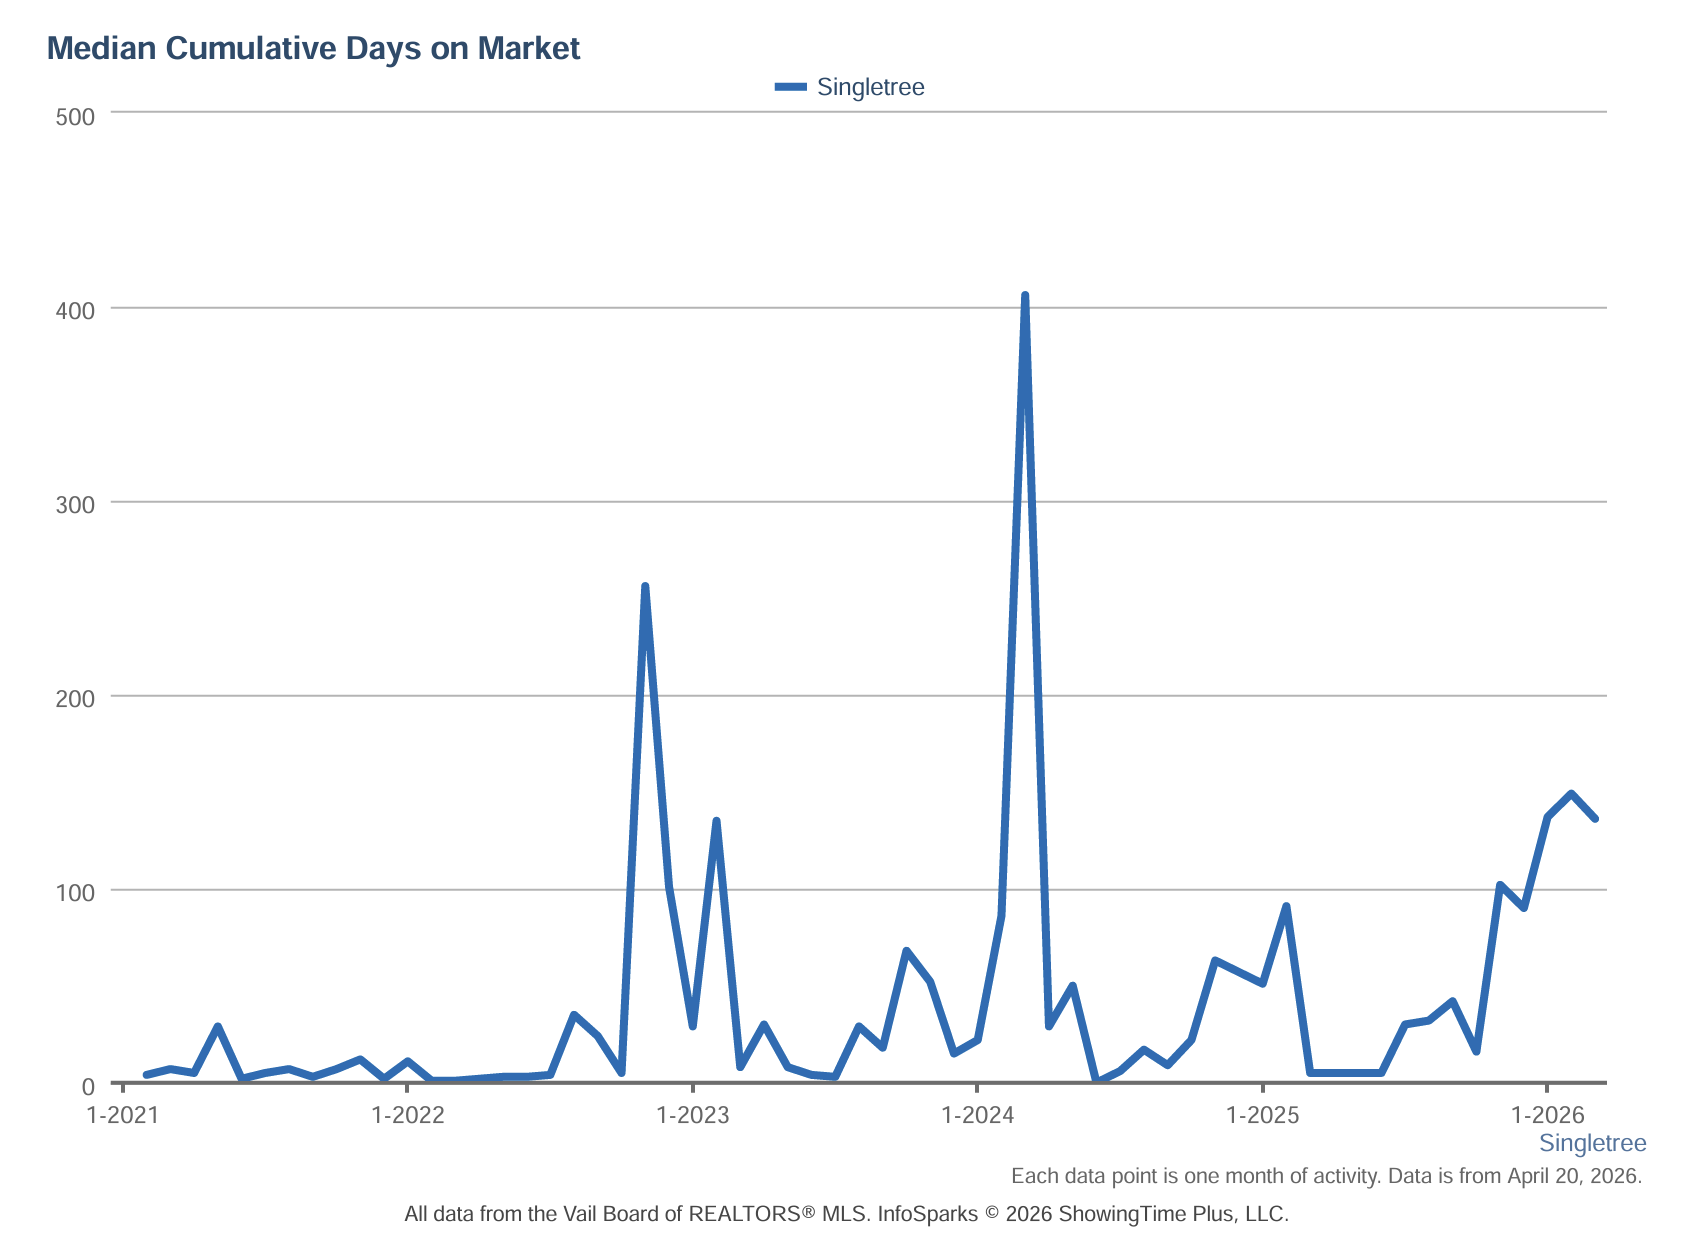
SINGLETREE – MEDIAN CUMULATIVE DAYS ON MARKET (LAST 5 YEARS)
Singletree shows a notably different rhythm. The 2021–2022 period was similarly hot, with DOM near zero through much of that stretch. The community then experienced a more pronounced adjustment period — a significant spike approaching 260 days in late 2022/early 2023, and then a truly dramatic outlier near 410 days in early-to-mid 2024.
That 2024 spike is the most eye-catching data point on this entire chart and deserves honest interpretation: in a neighborhood with moderate transaction volume, a single aspirationally-priced property that ultimately sold after an extended market time can single-handedly create that kind of statistical anomaly.
What matters more is what happened afterward. DOM collapsed back toward near-zero through late 2024 and into 2025, confirming that genuine buyer demand for Singletree remained intact. The more recent trend through early 2026, however, shows DOM creeping upward again toward the 100–150 day range.
Paired with the PPSF chart showing Singletree hitting that $1,000/SF milestone, this could reflect sellers testing new price ceilings and the market taking a moment to decide whether it agrees. Worth watching closely over the next two quarters.
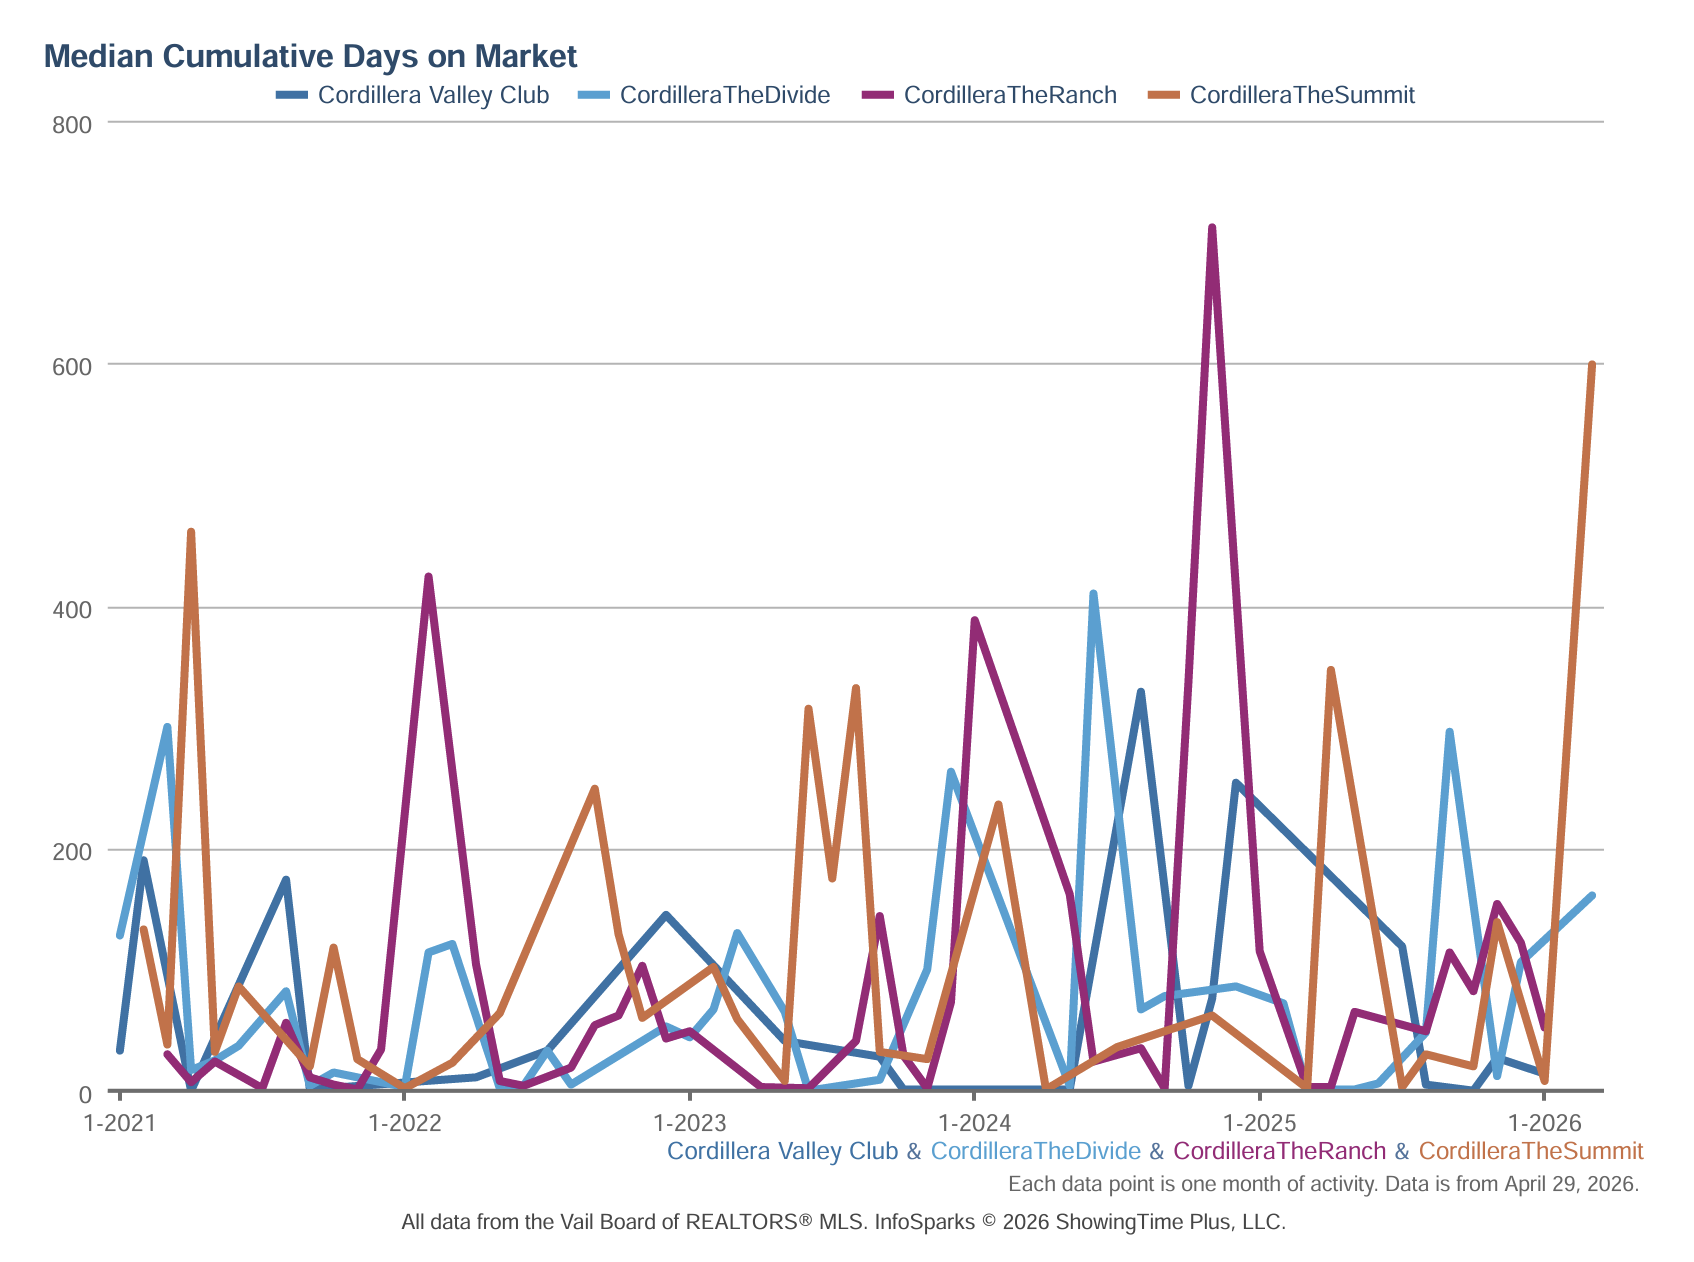
CORDILLERA – MEDIAN CUMULATIVE DAYS ON MARKET (LAST 5 YEARS)
Four sub-neighborhoods on one DOM chart makes for a busy picture, but several clear themes emerge. The first is that all four Cordillera neighborhoods had their fastest market periods in 2022–2023, when DOM regularly compressed to near-zero across the board. The pandemic demand surge hit Cordillera in the best possible way for sellers.
The Ranch produced the most dramatic DOM spike in the dataset with a reading approaching 720 days in mid-2025. This almost certainly represents a single property that endured a lengthy path to closing. It is emphatically not an indictment of The Ranch as a neighborhood. The subsequent return toward near-zero DOM in the following months confirms that appropriately priced properties in The Ranch continue to find buyers.
The Summit has shown persistently elevated DOM readings throughout the period, which is entirely consistent with its character. At 9,200 feet with a more limited buyer universe, a seasonal lifestyle, and price points in the $4M–$10M range, The Summit has always required patience. The recent spike toward 600 days in early 2026 is worth watching, but again – one lingering listing in a thin-inventory neighborhood can produce numbers that look alarming in the aggregate while telling a story about a single property, not a market.
The Valley Club has generally shown the most compressed and consistent DOM of the four sub-neighborhoods, reinforcing what the MSP and PPSF data already suggested: this is where the most active and confident buyer demand within Cordillera is currently concentrated. Peaks toward 250–330 days have occurred but resolved quickly, and the general pattern is of a neighborhood where well-priced properties move.
The Divide shows a mixed pattern with periods of very fast absorption punctuated by elevated readings which is consistent with a neighborhood where transaction volume is low enough that individual listings can dramatically skew the monthly median.
SUMMARY
Across all three communities, the DOM data reinforces a consistent theme — the 2021–2022 frenzy was a once-in-a-generation demand event, the 2023–2024 period represented a recalibration, and we are now in a more deliberate, discerning market where pricing strategy matters enormously. The days of buyers waiving inspections (which I never recommend) and closing above ask on anything that hit the MLS are few and far between. But demand hasn’t evaporated, it has matured. Buyers in these golf communities are sophisticated, they have options, and they know it. Sellers who price with discipline and present their properties well are still finding buyers. Those who test the ceiling are finding out, in real time, what “cumulative” days on market actually means.
In short: it’s still a very good market to sell in. It’s just not a forgiving one.
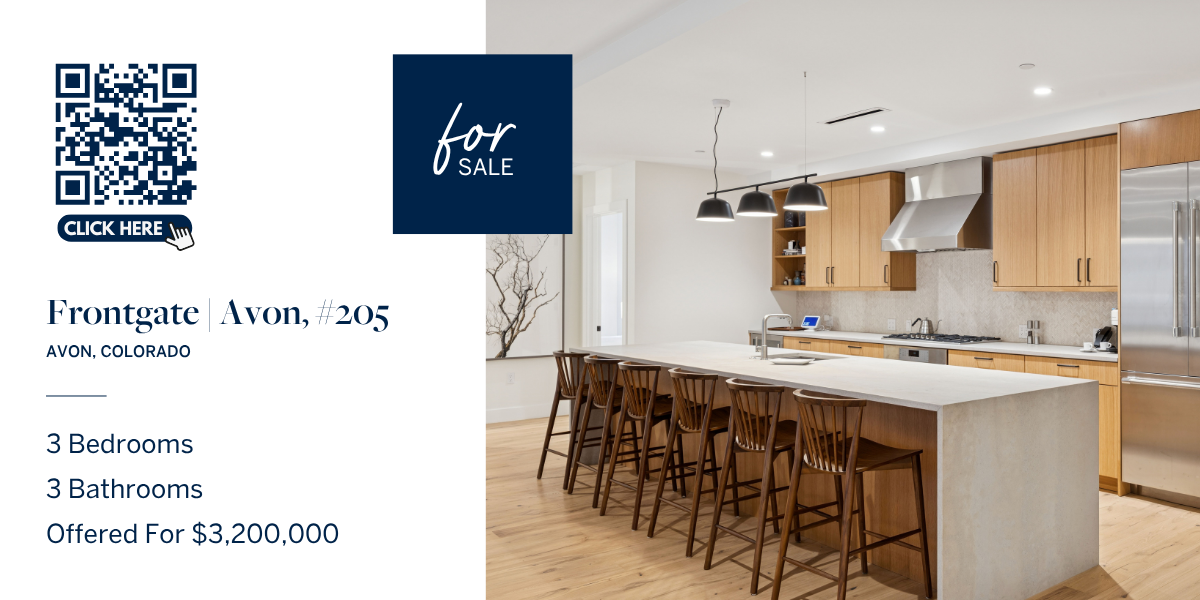
Currently the only available 3-bedroom, 3-bath residence at the coveted Frontgate | Avon, this impeccably designed residence 205 combines sophisticated mountain living with unparalleled amenities. One of the most spacious three-bedroom layouts in the complex, it features 9-foot ceilings in the inviting open-concept great room, and a generous 164 sq ft patio that opens directly onto the serene Mountainside Courtyard – an ideal setting for indoor-outdoor entertaining. Offered beautifully furnished….VIEW MORE DETAILS
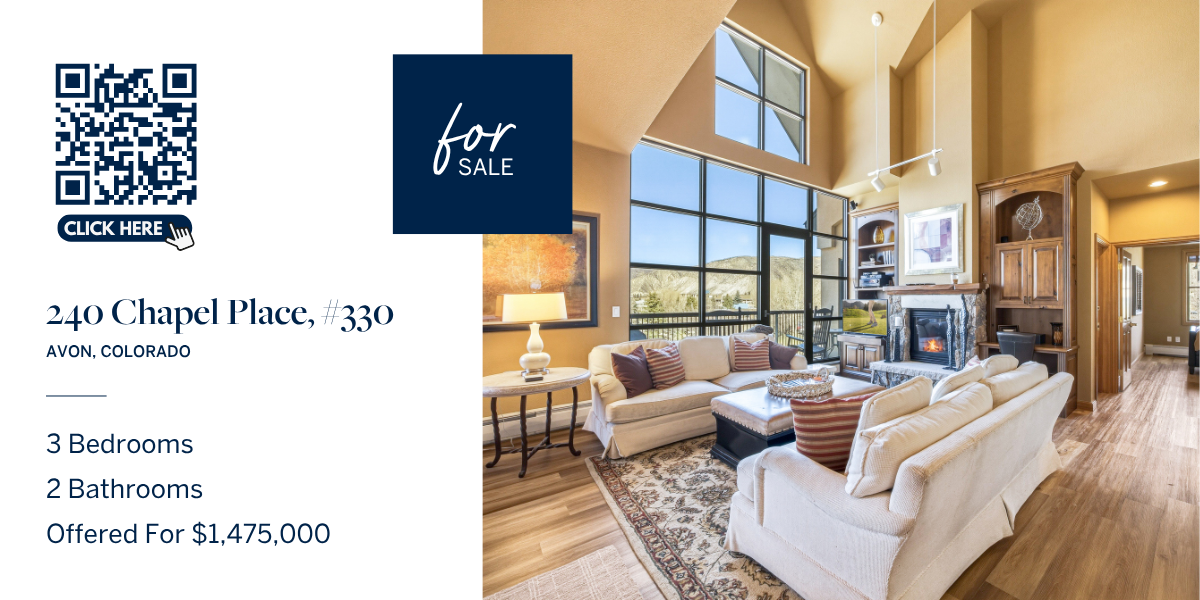
Perched atop Chapel Square, this premier penthouse residence offers an exceptional blend of refined mountain living and effortless convenience in the heart of Avon. This remodeled 3-bedroom, 2-bath residence showcases soaring vaulted ceilings and an inviting great room that captures sunset views, extending seamlessly to a generous private balcony. Thoughtfully updated from its original finishes, the residence is offered turn-key furnished, allowing for immediate enjoyment or seamless rental readiness. The building features secure, code-accessed elevators, two…VIEW MORE DETAILS
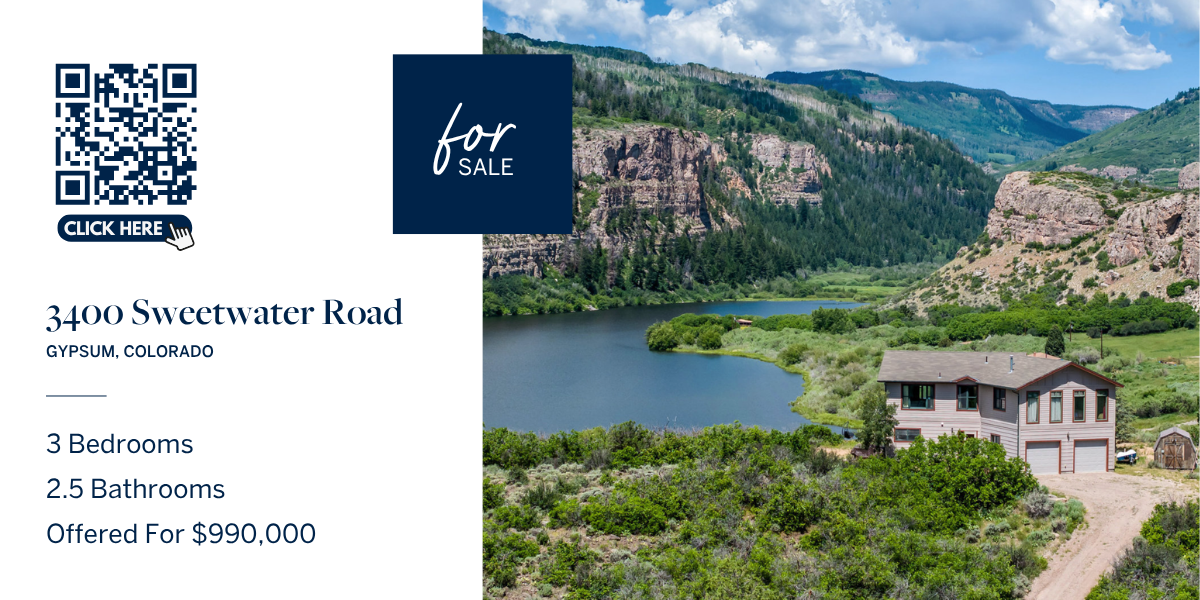
A true ”Diamond in the Rough” gem for an outdoor lover’s dream! Offered at over $120,000 below assessed value. Welcome to ”Sweetwater Perch”– for those who crave adventure and tranquility. Perched atop a gentle knoll in the peaceful Sweetwater Ranch area, this lakefront oasis offers breathtaking 360-degree views that are sure to inspire. Whether you’re a writer, artist, or simply someone who loves the great outdoors, this property provides the perfect setting. This charming 3-bedroom, 2.5-bath home features a spacious, open floor plan and generously sized bedrooms, creating a relaxing retreat for family and friends. The panoramic vistas are among the best in the county, making every day feel like a getaway. Endless outdoor activities await literally steps from your door–enjoy paddle boarding, fishing, hiking, bird watching….VIEW MORE DETAILS
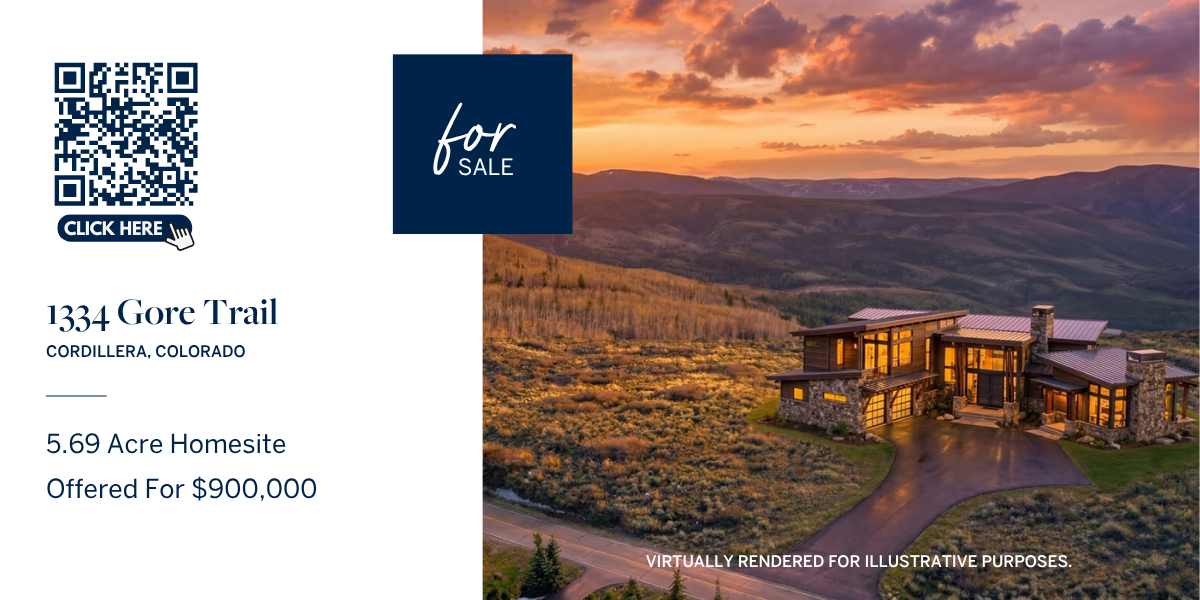
In Edwards, Colorado, over five and a half acres of south-facing high-desert terrain awaits your vision. This is not JUST a building site, it is a position. Set within the gates of the Summit at Cordillera, this exceptional homesite offers a rare opportunity to create a legacy mountain residence in one of the Vail Valley’s most coveted settings. Surrounded by native sagebrush, golden grasses, and seasonal wildflowers, the property captures sweeping panoramic views of layered mountain ranges and enjoys a sun-drenched orientation that enhances both year-round comfort and natural…VIEW MORE DETAILS
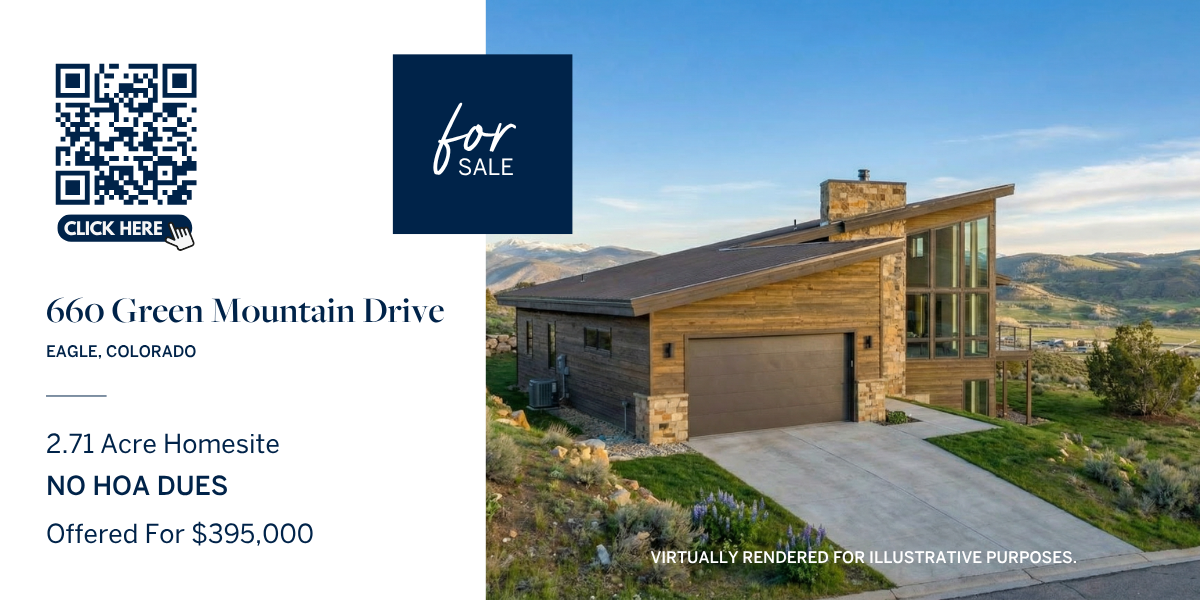
Rarely does an opportunity like this present itself, a vacant lot with no HOA Dues! Tucked at the end of a quiet cul-de-sac, this 2.71+/- homesite captures expansive southwest views toward Hardscrabble Mountain and overlooks the scenic Brush Creek Valley, offering both privacy and breathtaking Colorado beauty. Located in unincorporated Eagle County within the Eagle Hills Subdivision, in the neighborhood known as Upper Kaibab, this property offers flexibility with limited covenants (available upon request). A previous soils test and topographical survey completed in 2017…VIEW MORE DETAILS
Experience elevated mountain living in this premier 3-bedroom + flex den penthouse, originally envisioned as the developer’s residence. Designed to impress, the home features dramatic extra-high ceilings and an expansive single-level open floor plan that delivers both sophistication and comfort. The enclosed den, accented with elegant sliding barn doors, offers exceptional versatility and is enhanced by a custom, temperature-controlled, sub-zero, 150+ bottle wine closets…VIEW MORE DETAILS